Pixel operations
Pixel-wise computations
Using gdal raster calc
It performs pixel-wise calculations on one or more input GDAL datasets. This example uses the s2_TER_10m.xml
dataset created in the Hidden feature: symbolic links and subdatasets section of the tutorial.
Let's compute a grayscale view using the well-known formula:
$ gdal raster calc --input s2_TER_10m.xml --output grayscale.tif --output-data-type UInt16 --calc "0.299 * X[1] + 0.587 * X[2] + 0.114 * X[3]"
Let's use an aggregate function avg with --flatten to indicate we only want one single output band, so
that avg(X) is expanded to avg(X[1], X[2], X[3], X[4], X[5], X[6].
$ gdal raster calc --input s2_TER_10m.xml --output avg.tif --output-data-type UInt16 --flatten --calc "avg(X)"
We can also doing the same using the mean builtin function;
$ gdal raster calc --input s2_TER_10m.xml --output mean.tif --output-data-type UInt16 --flatten --calc "mean" --dialect builtin

$ gdal raster compare avg.tif mean.tif
Exercise
Compute the Normalized difference vegetation index (NDVI) using the well-know formula:
Do the same but after having separated the NIR and Red bands into 2 separate files, and do not create any materialized (i.e. actual image) file in the process.
Create a .gdalg.json file with a simple pipeline computing the NDVI for one file, and replay that pipeline using substitutions to apply it to another Sentinel 2 tile
Focal statistics
Using gdal raster neighbors
Compute the value of each pixel from its neighbors (focal statistics).
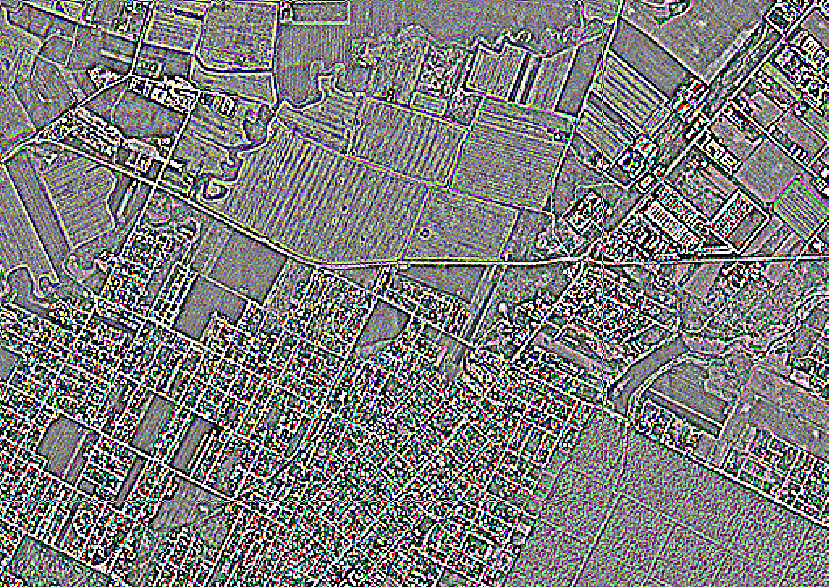
Let's attempt edge detection with the edge1 kernel:
$ gdal raster neighbors s2_TER_10m.xml edge1.tif --kernel edge1 --overwrite
Result:
Zonal statistics
Using gdal raster zonal-stats
We are going to compute the average elevation in provinces around Timișoara.
First let find out the extent of our DEM:
$ gdal raster info dem.tif
Upper Left  (  19.6854167,  46.9537500) ( 19d41' 7.50"E, 46d57'13.50"N)
Lower Left  (  19.6854167,  45.0565278) ( 19d41' 7.50"E, 45d 3'23.50"N)
Upper Right (  22.4426389,  46.9537500) ( 22d26'33.50"E, 46d57'13.50"N)
Lower Right (  22.4426389,  45.0565278) ( 22d26'33.50"E, 45d 3'23.50"N)
Center      (  21.0640278,  46.0051389) ( 21d 3'50.50"E, 46d 0'18.50"N)
Let's extract (but not clip) provinces that intersects that extent
$ gdal vector filter --bbox=19.6854167,45.0565278,22.4426389,46.9537500 \
    /vsizip/ne_10m_admin_1_states_provinces.zip admin_1_around_timis.gpkg
Note
If you are using the MSYS2 on Windows environment, and you set
MSYS_NO_PATHCONV=1 in the VSI tutorial you may see the error below:
ERROR 4: C:/gdal/msys64/vsizip/ne_10m_admin_1_states_provinces.zip: No such file or directory
Switch path conversion back on with:
$ export MSYS_NO_PATHCONV=0
When run successfully the output will be:
Warning 1: A geometry of type MULTIPOLYGON is inserted into layer ne_10m_admin_1_states_provinces of geometry type POLYGON, which is not normally allowed by the GeoPackage specification, but the driver will however do it. To create a conformant GeoPackage, if using ogr2ogr, the -nlt option can be used to override the layer geometry type. This warning will no longer be emitted for this combination of layer and feature geometry type.
Not critical, but we can fix it cleanly with:
$ gdal vector pipeline read /vsizip/ne_10m_admin_1_states_provinces.zip ! \
    filter --bbox=19.6854167,45.0565278,22.4426389,46.9537500 ! \
    set-geom-type --geometry-type MULTIPOLYGON ! \
    write admin_1_around_timis.gpkg --overwrite

And finally:
$ gdal raster zonal-stats dem.tif --stat mean --zones admin_1_around_timis.gpkg \
    dem_zonal_mean.gpkg --include-field admin,name --overwrite --include-geom
Exercise
Find the point of maximal elevation in each zone.
Bonus point for a pipeline avoiding the creation of the materialized admin_1_around_timis.gpkg.
(hint)
Hint
Look at documented examples of gdal raster zonal-stats